Overview
In the first part of this series of article about Advanced Microservice Monitoring I explained what is needed to prepare your microservice so they can be integrated in a monitoring solution.
In this second part I will guide you to setup a whole monitoring system on a separate Server / Virtual Machine (VM).
Why do we need a separate server / VM you might ask? We want to have a reliable monitoring system which runs 24/7 and of course to detect when something is wrong with our services. Running it on a local computer or the same instance we have our microservices running does not make much sense in that case.
Let’s see how we can setup such an environment!
VM Setup
Prerequisites
To set up the advanced microservice monitoring you need the following at things available:
- A public available VM with at least 4 GB of RAM (AWS EC2, Azure etc.)
- SSH Access to that VM
- Docker installed on the VM
- Basic docker skills
- Cumulocity Tenant with Microservice Feature enabled
- Microservices you want to monitor
 (see first part)
Prepare docker-compose.yml
Instead of installing each component one-by-one, we want to use a docker-compose.yml file that pulls all docker images with the correct configuration and start the containers.
Please note: For grafana alerting to send emails we need to configure a SMTP server. If you don’t want to use this function you can just remove the missing properties from the docker-compose.yml below.
version: "3"
services:

  prometheus:
    image: prom/prometheus
    ports:
      - 9090:9090
      - 9093:9093
    restart: always
    extra_hosts:
      - "host.docker.internal:host-gateway"
    volumes:
      - ./prometheus:/etc/prometheus
      - prometheus_data:/prometheus

  grafana:
    image: grafana/grafana
    ports:
      - 3000:3000
    depends_on:
      - prometheus
    restart: always
    environment:
      - GF_SMTP_ENABLED=true
      - GF_SMTP_HOST={yourSMTPServer}
      - GF_SMTP_USER={yourSMTPUser}
      - GF_SMTP_PASSWORD={yourSMTPPassword}
    volumes:
     - grafana-storage:/var/lib/grafana

volumes:
  grafana-storage:
  prometheus_data:
Please note: This docker-compose does assume that you will have a load balancer securing your traffic. If this is not the case you might want to add a reverse proxy like nginx to provide https secure endpoints for grafana and prometheus.
- Log in to your VM via SSH
- Navigate to the folder you to store the data & configuration
- create a file ‘docker-compose.yml’ by using
ornano docker-compose.ymlvi docker-compose.yml - Copy & paste the docker compose content from above to that file.
- Save the docker-compose.yml file
Configure Prometheus
Before we can start the prometheus docker container we need to adjust the prometheus configuration. This includes basic configuration but also to define which microservice metrics should be integrated.
In the first part of this article series I deployed two microservice (1 Java + 1 Python microservice). Now I need to add them to my configuration.
Here is my example configuration for prometheus:
global:
  scrape_interval: 5s

scrape_configs:

  - job_name: 'MQTT microservice'
    basic_auth:
      username: {Your Cumulocity User}
      password: {Your Cumulocity Password}
    static_configs:
    - targets: ['{Your Cumulocity Tenant}'] #without http(s):// prefix
      labels:
        hoster: 'SAG'
        env: 'eu-latest'
        app: 'MQTT Microservice'
    metrics_path: /service/mqtt-mapping-service/prometheus
    scheme: https
    honor_labels: true
  - job_name: 'Python microservice'
    basic_auth:
      username: {Your Cumulocity User}
      password: {Your Cumulocity Password}
    static_configs:
    - targets: ['{Your Cumulocity Tenant}'] #Your Cumulocity Tenant URL
      labels:
        hoster: 'SAG'
        env: 'eu-latest'
        app: 'hello-world Microservice'
    metrics_path: /service/hello-world-metrics/prometheus
    scheme: https
    honor_labels: true

rule_files:
  - alarm_rules.yml

alerting:
  alertmanagers:
  - static_configs:
    - targets: ['alertmanager:9093']
The scrape_interval defines the frequency how often metrics data should be fetched from the endpoints.
job_name is the name of the microservice you want to fetch. For each instance of a microservice you need one job in the configuration.
labels help you to identify your microservice.
Change the following in the config & save it locally:
- You need to have at least one job (for each microservice endpoint one). Give it a meaningful name.
- Adapt the user + password to your credentials. It is strongly suggested to use a very limited user with no global rights. The prometheus endpoint does not require any roles so any valid user can access it.
- Adapt the targets to your tenant URL
- Adapt the metrics_path to the path of your microservice.
- Add or adapt the labels so you can easily identify your microservice
Now create or copy the file on/to your VM:
- Create a new folder ‘prometheus’ in the folder where you have created the docker-compose.yml
mkdir prometheus - Create a file prometheus.yml in that folder
cd prometheus nano prometheus.yml - Copy & Paste your adapted prometheus configuration.
Start the containers
Now we can start prometheus & grafana with
docker-compose up -d
After some time you can check if with
docker ps
if both containers are up & running.
If you have local access to your VM you can now access grafana & prometheus locally.
grafana: 					localhost:3000
prometheus: 			    localhost:9090
prometheus-alertmanager:	localhost:9093
(Optional) Adjust your firewall rules
Normally you want to expose the services to be available from “outside” so you need to adapt your firewall rules, load balancers or reverse proxy configuration.
As this really depends on your environment I cannot give detail guidance here just pointing out the ports the services are listening on and might be exposed.
Grafana Configuration
Now that everything is up and running we can login to the grafana UI with the initial credentials User admin, Password admin

- As a first step you have to set a new strong password for the admin user.
- After login we add a new data source and select Prometheus
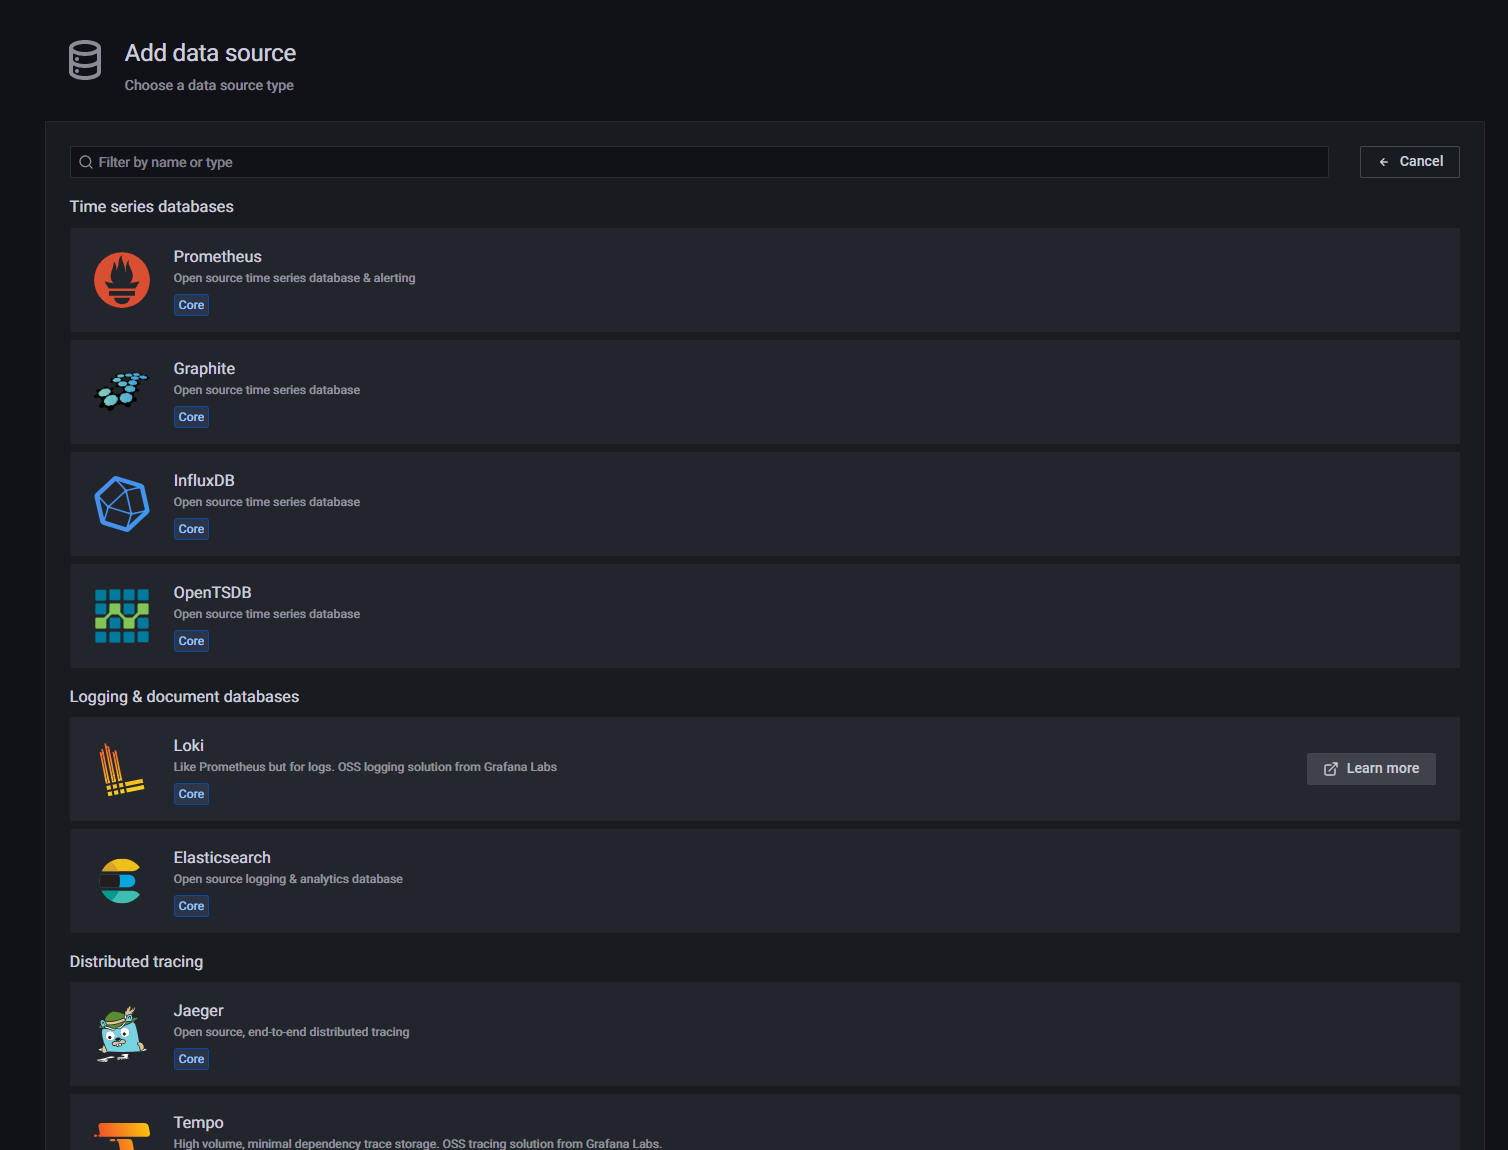
- As grafana and prometheus are running on the same machine we just need to enter http://prometheus:9090 to reach the prometheus server. Afterwards we click on Save & test. You should get the message that the Date Source is working

Great now everything is set up to create our first Dashboard!
Summary & Next Steps
In this second part of the series Advanced Microservice Monitoring I explained how to setup your monitoring environment and do the basic configuration.
In the next and last part I show how you can leverage the capabilities of grafana to build your own monitoring dashboard.
Please continue your reading here: