Overview
In the first part and second part of this series of articles about Advanced Microservice Monitoring I explained what is needed to prepare your microservice and to setup an independent monitoring environment using prometheus & grafana.
In this part I will show you how you can use the capabilities of grafana to build efficient monitoring dashboards for your microservices and configure alerting when something unexpected is happening.
Let’s go!
Create Micrometer Monitoring Dashboard
In the first part I demonstrated that java microservice can be easily enabled using Spring Boot & Micrometer. Because of the standardized metrics of the JVM we can now add a Micrometer default dashboard to grafana with a few clicks only.
- Go to JVM (Micrometer) | Grafana Labs to check out the Micrometer default dashboard. Copy the id 4701.
- Go to your grafana instance and click on Dashboards → New → Import
- In the next screen we enter 4701 and click in Load

- Select the data source prometheus and click on Import.

- Here is our pre-build dashboard for our Java microservice!

As you can see all JVM metrics are available in that dashboard. This is a very detailed dashboard to monitor Java based microservices.
Create a custom Monitoring Dashboard
Let’s have a look on our python microservice. Here we have standard & custom metrics defined which we can now visualize in a dashboard.
Our goal is to create a similar Dashboard we had with Micrometer. We have an overview section where we display all the most relevant information like
- Start Time
- Status
- Memory Usage
- CPU Usage
Overview Row
We start with creating a new Dashboard:
- Click on new Dashboard icon on the left menu.
- Add a new row. We name it Overview.
- Add a panel of type stat to that row. We name it Start Time to display the time the microservice has been started last time.
- In the Query section we click on Code and enter
process_start_time_seconds{app="hello-world Microservice"}*1000 - In Panel option section we change the unit to Datetime ISO which will convert the TS in a readable date time format.
- In Thresholds you can remove the 80 red one to always show it green formatted.
- Click on Apply to add the panel to our Dashboard.

Now we add another panel which shows the current status of our microservice.

-
Add a panel of type stat. Name Status
-
Query:
up{app="hello-world Microservice"} -
Panel Options Unit to String
-
Add two value mappings with the color codes green & red

-
With apply we add it to our Dashboard.
Repeat the steps above for the following metrics / queries:
process_resident_memory_bytes{app="hello-world Microservice"} / process_virtual_memory_bytes{app="hello-world Microservice"}process_usage{resource_type="cpu_usage"}
You might add a filter for the apps if you have multiple microservices with that metric deployed.
In the end you should have something like this

Memory Row
Now let’s add some timeseries metrics & panels to get more insights of what’s going on in our microservice.
- Add a new row and name it Memory
- In that row create a new time series panel with the following query:
process_resident_memory_bytes{app="hello-world Microservice"}
- Select the Unit bytes (IEC)
- Make sure to select a custom label for your query and name it Process Memory Used
- Apply the panel and move it the Memory row.

Repeat the steps above to add the following system memory metrics in a system time series panel:
system_usage{resource_type="memory_used"}system_usage{resource_type="memory_available"}system_usage{resource_type="memory_free"}
In the end your dashboard should look like this:

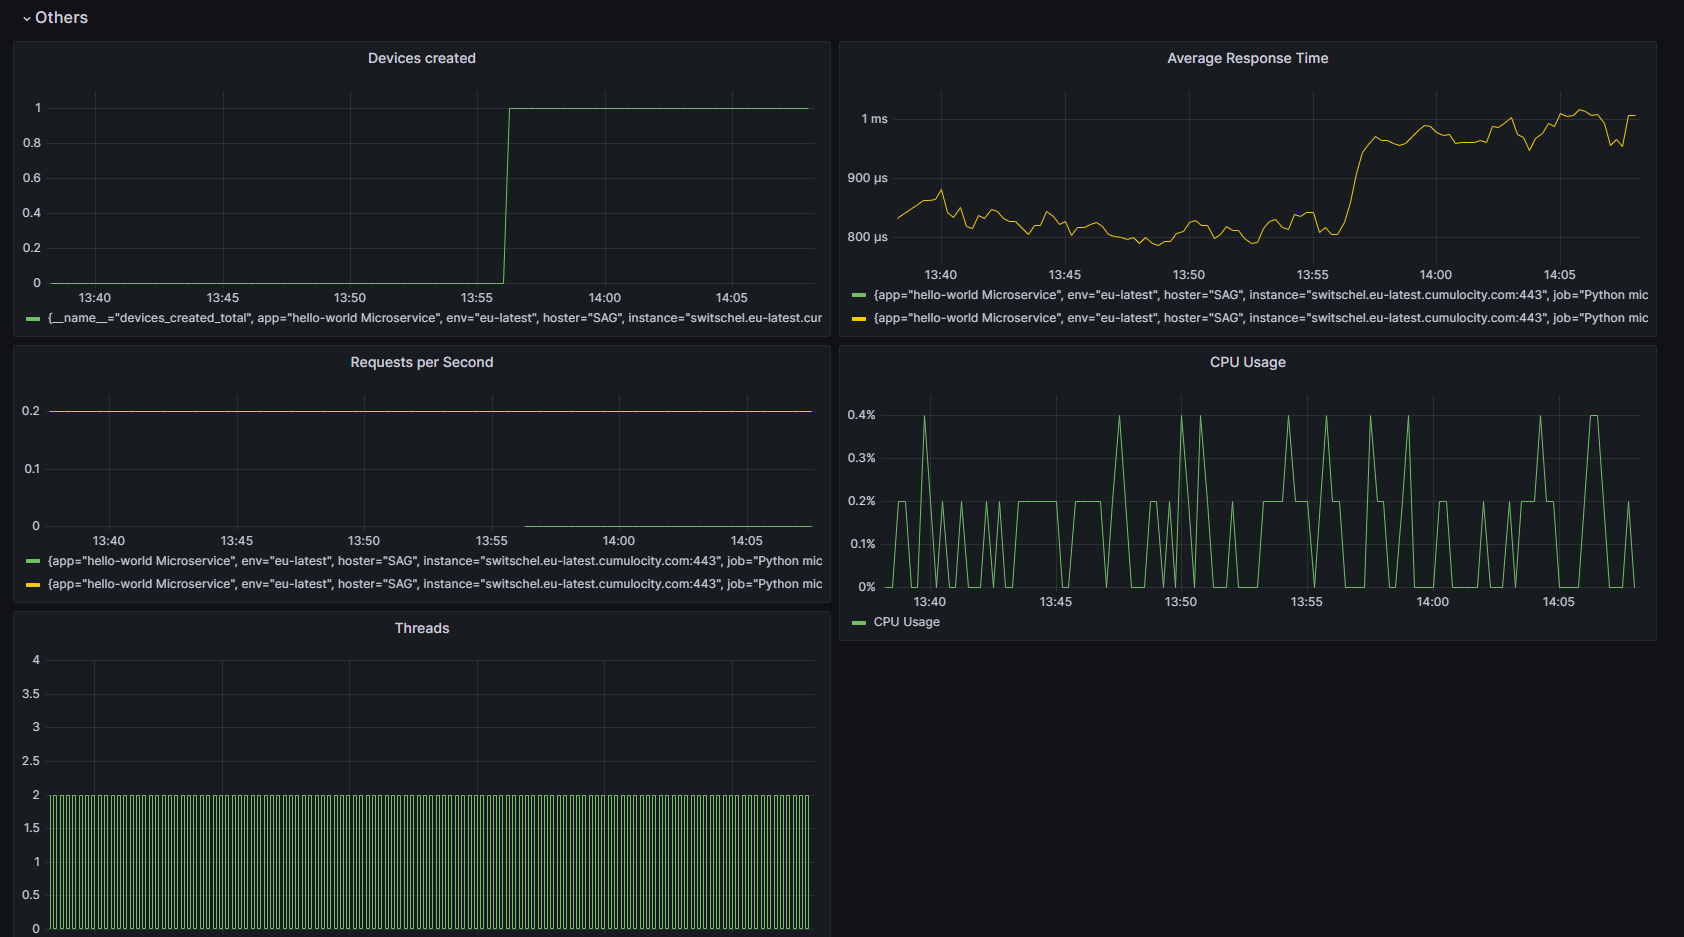
Others Row
In the Others Row we add HTTP & business metrics. As explained in the first part we have this available for the python microservice.
- Add a new row and name it Others
- Add a time series panel with the query:
devices_created_total - Repeat the step above for the following query:
This query will return the number of successful Flask requests per second. Shown per path.rate( flask_http_request_duration_seconds_count{status="200"}[30s] ) - For the average response time we can add the following query in an additional panel:
rate( flask_http_request_duration_seconds_sum{status="200"}[1m] ) / rate( flask_http_request_duration_seconds_count{status="200"}[1m] ) - Feel free adding additional values like threads, CPU usage or other metrics to your dashboard!
Using the monitoring dashboards
After you’ve defined your dashboard you can start using them. Basically you are looking on a dashboard when you want to know what’s going on with your microservice or if you want find a potential root cause of issues you are already aware of.
In grafana you can do that by using specific filters in the dashboard. The most powerful filter is the time filter. In the top right you can select the time frame you want to have a closer look.
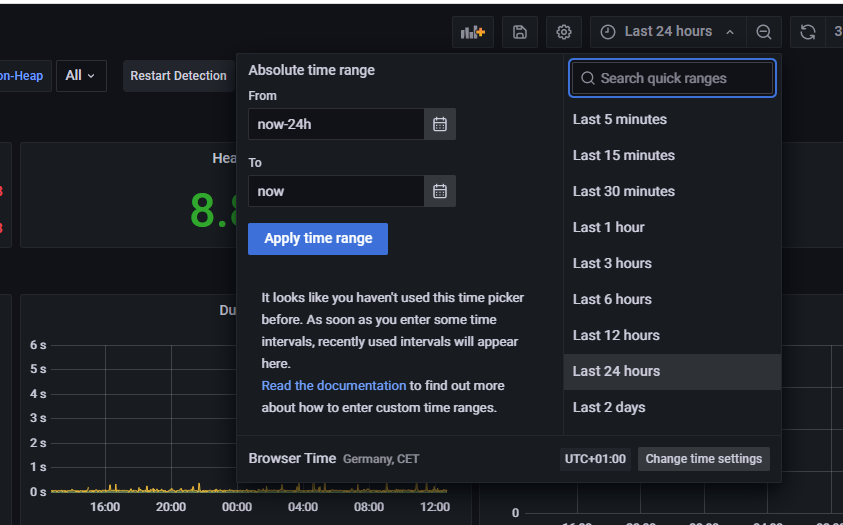
For example you can select “Last 24 hours” which will change all panels accordingly. This has especially impact on the time series & other historic panels.
A good example doing this is a to select a peak hour where you expect special load on the microservice e.g. all devices wake up at the same time etc.
For custom filters on specific metrics you can use variables.
Alerting
Having a dashboard to monitor your microservices is nice but you don’t sit 24/7 in front of your monitor watching the dashboard. More likely you will open the dashboard only when you will be informed that something suspicious is happening to dig in and find potential root causes. This can be achieved by using Alerting in grafana.
In our use case we want to get informed when our microservice is “down”.
Let’s create that rule:
-
Click on Alerting in the left menu
-
Click on New alert rule.
-
The name of the rule should be Microservices health alert.
-
We stick to grafana managed alert as we don’t have mimir or loki installed
-
As a query we select the metric up
-
Select
now - now - 1mso the query will be evaluated each minute. -
If we click on Run queries we could see the current results.
-
In block C we change the threshold to is
below 1. The “firing” indicator will switch to Normal when we run the query again.

-
Create a new folder to store the rule with name microserviceRules
-
For group we choose health
-
The for duration defines how long the alarm should be in state pending until it is fired. In our case we set it to “1m”.
-
If you want you can add a meaningful summary and description.
-
In step 5 we have to create new labels which we can use to notify someone. We enter health as key and down as value.
-
Click on Save and exit the alert rule.
-
In the overview you should see now your new created rule. After some time the state of the rule for each microservice will be updated:
-
In Contact points you can add your email address to grafana-default-email contact point or define a new template which you want to send.
Note: If you just change the email address in grafana-default-email the standard template will be used.
-
If you now unsubscribe the microservice to force a down of the microservice you’ll get an email after 1-2 minutes in your inbox of the provided email address


Summary & Next Steps
In this last part I demonstrated how you can re-use existing templates like micrometer to get an ready-to-use dashboard. Also for custom microservices I showed how you can define your own dashboard with just a few clicks. As the dashboard is most likely not watched 24/7 I showed how you can create an alert which sends an email when some thresholds are breached.
If you’ve read all 3 articles you know…
- how to prepare your microservices to be monitored
- how to setup your monitoring infrastructure with prometheus & grafana
- how to create dashboard & alerts to monitor your Cumulocity IoT microservices

Don’t hesitate to comment any of these 3 articles with any question or feedback!