Real-time monitoring for webMethods Integration Server
Most of the available profiling tools only provide Java® class or method-level profiling with no relation to Integration Server (IS) flow service. They also consume a lot of system resources, cannot be deployed in production and often require an application restart to enable profiling. In addition, manual correlation of data from different systems is required by the operations team to identify problems. SKY Profiler offers an exciting alternative to all these issues.
SKY Profiler is an open-source tool designed to monitor IS service invocations in real time. The profiler helps users track down the time taken for each service invocation and further drill down to the child services, identifying which child service contributes to maximum response time.
Key features of SKY Profile
With SKY Profiler you cannot only monitor multiple IS invocations in a single dashboard but also:
- Use plug & play features suitable for production
- Start & stop profiling as and when needed, without having to restart IS
- Create baseline setting and alerts for baseline breaches to compare against SLA violations
- Create a correlation of system usage to identify bottlenecks
- Report generation features for offline analysis
- Use minimal memory and CPU, which makes SKY Profiler ideal for production systems
How it works
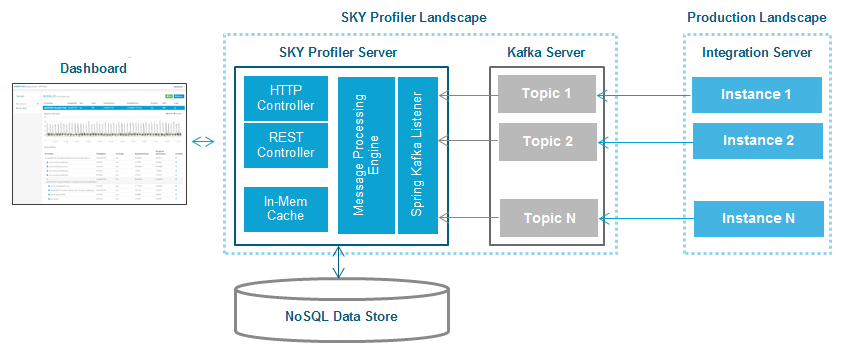
SKY Profiler is built using Server – Agent model. The agent is an IS package [SKYProfilerRuntime] which needs to be deployed on the IS that needs to be monitored. The Server component [SKYProfilerServer] can be deployed in a machine other than production instance of IS along with the database and messaging component (see Figure 1).
Fig.1: Architecture
All of the IS packages for a transaction are identified and monitored within the SKY Profiler dashboard. When monitoring is started, all of the services executed from the selected packages are tracked and an event with service execution details is published to the Kafka™ topic. Along with the service event, another event which contains system resource statistics will be published. The Kafka listener in the server consumes the event, processes it, persists it in the database and sends the data to the user interface for display.
Getting Started with SKY Profiler
1.1 Installation
SKY Profiler source code is open source and can be downloaded from GitHub®. It can be cloned locally following the link.
To compile and build the SKY Profiler server binary from the source code:
c:/{webMethods-IntegrationServer-SKYProfiler}> antThis will create SKY Profiler package and server jar. Deploy SKY Profiler package [Agent] in the IS that needs to be monitored. Run the SKY Profiler server jar to start the application [Server].
Note: For pre-requisites and detailed installation steps, refer to the GitHub link.
1.2 Usage
In order to start monitoring IS using SKY Profiler, you need to go through these steps:
- Login to the SKY Profiler server application.
- Add the IS that needs to be monitored.
- Select the package/s which needs to be monitored and provide messaging component details in configuration screen.
- Click on “Start” button on main dashboard to start monitoring.
Any service execution that belongs to the selected package/s will get displayed in the Service Monitoring table on the dashboard.
1.3 Bottleneck analysis
To create a bottleneck analysis, you have to:
- Click on the service name in “Service Summary Table” to expand the collapsible bar.
- A Response Time graph will be shown. (Only the latest service execution response times will be displayed). Click on one of the data points in the graph to get Service Call Tree.
- Service Call Tree displays service execution hierarchy along with time each service takes to execute. This information can be used to find the service that took most of the time in the entire service execution response time. Click on the Correlation icon corresponding to the service that took most of the time.
- This opens up a modal window containing system resource usage graphs such as CPU, disk, network, GC and service specific graphs such as service response time and Thread Level CPU.
- Click on the data point in one of the graphs to highlight the correlation line across all the graphs.
- These graphs help you to map the response time with other system resources to identify the bottleneck.
1.4 Report
Produce a report and get an instant insight in two easy steps:
- In the main dashboard screen, Click on Options > Report.
- An HTML report will be generated and can be saved locally for offline analysis.
Conclusion
SKY Profiler is a real-time IS service profiling product that helps to easily identify performance bottlenecks during service execution. It benefits operational teams and helps them avoid downtimes. Internal lab results demonstrate less than 2% of overall CPU consumption, 1.5% of throughput and negligible memory footprint as the profiled data gets pushed away from IS to Kafka topic. With less overhead and memory footprint, it is suitable for production usage and perhaps the best part is that the source code is open source and available on GitHub.
To learn more, visit SKY Profiler on TECHCommunity.
Start today!
The source code of SKY can be accessed and cloned at SKY Profiler on GitHub
Should you have any questions, do not hesitate to contact me.
