What product/components do you use and which version/fix level are you on?
latest
Is your question related to the free trial, or to a production (customer) instance?
production
What are you trying to achieve? Please describe it in detail.
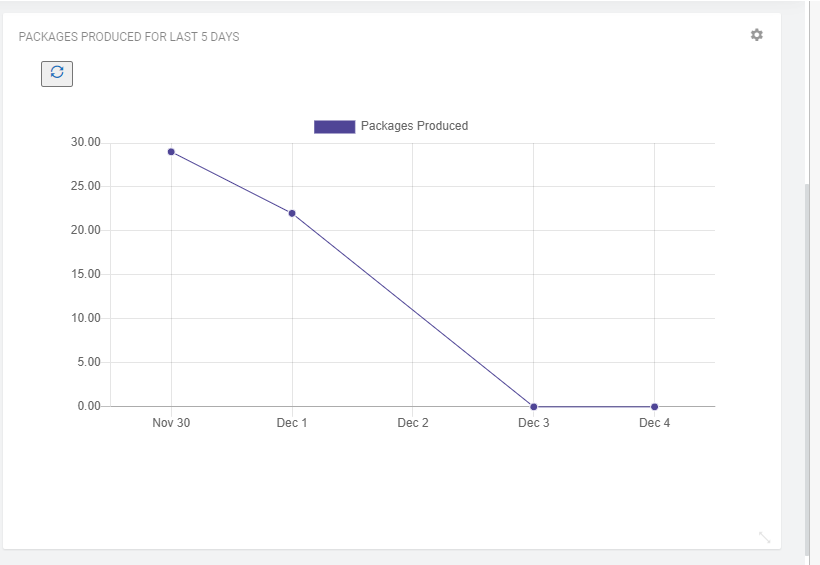
We are trying to display the packages produced on the line graph for the last 5 days.
We have configured the cumulocity-datapoints-charting-widget for this feature.

Below is the output of this configuration. The behaviour of this graph is false.

When we reloaded the widget the graph shows the correct behaviour.
Do you get any error messages? Please provide a full error message screenshot and log file.
Have you installed all the latest fixes for the products and systems you are using?
yes