1st iPaaS Puzzle: Local Drought Water Calculator

This is a first in a series of 5 iPaaS Puzzles we are posting in the next couple of weeks. Don’t we all love a little Puzzle, even more if it helps us keep our webMethods skills sharp. If the solution is practical and immediately applicable to the benefit of the environment even better! :slight_smile:

1st iPaaS Puzzle: Local Drought Water Calculator

image

Picture from SWR Aktuell

My mother recently pointed out to me that in Freiburg, citizens are adopting trees and watering them in their neighborhoods. (Article is in German. English translation via Google).

Like many areas of the world, Freiburg is living through one of the worst droughts in recent memory. It is so bad, that concerned folks in the cities are adopting trees to prevent them from dying, giving them up to 100 liters of water when needed.

On some days there was some rainfall, often overnight when you have little idea of how much actually came down. Fresh water is precious, you want to minimize how much of that precious water you need to use to safe your tree.

Our First iPaaS Puzzle Question to be solved is:

How much additional water should the people give their adopted trees on these days of light rainfall?

There are public APIs that you can call to find out how much rain came down the last 24 hours in your area.

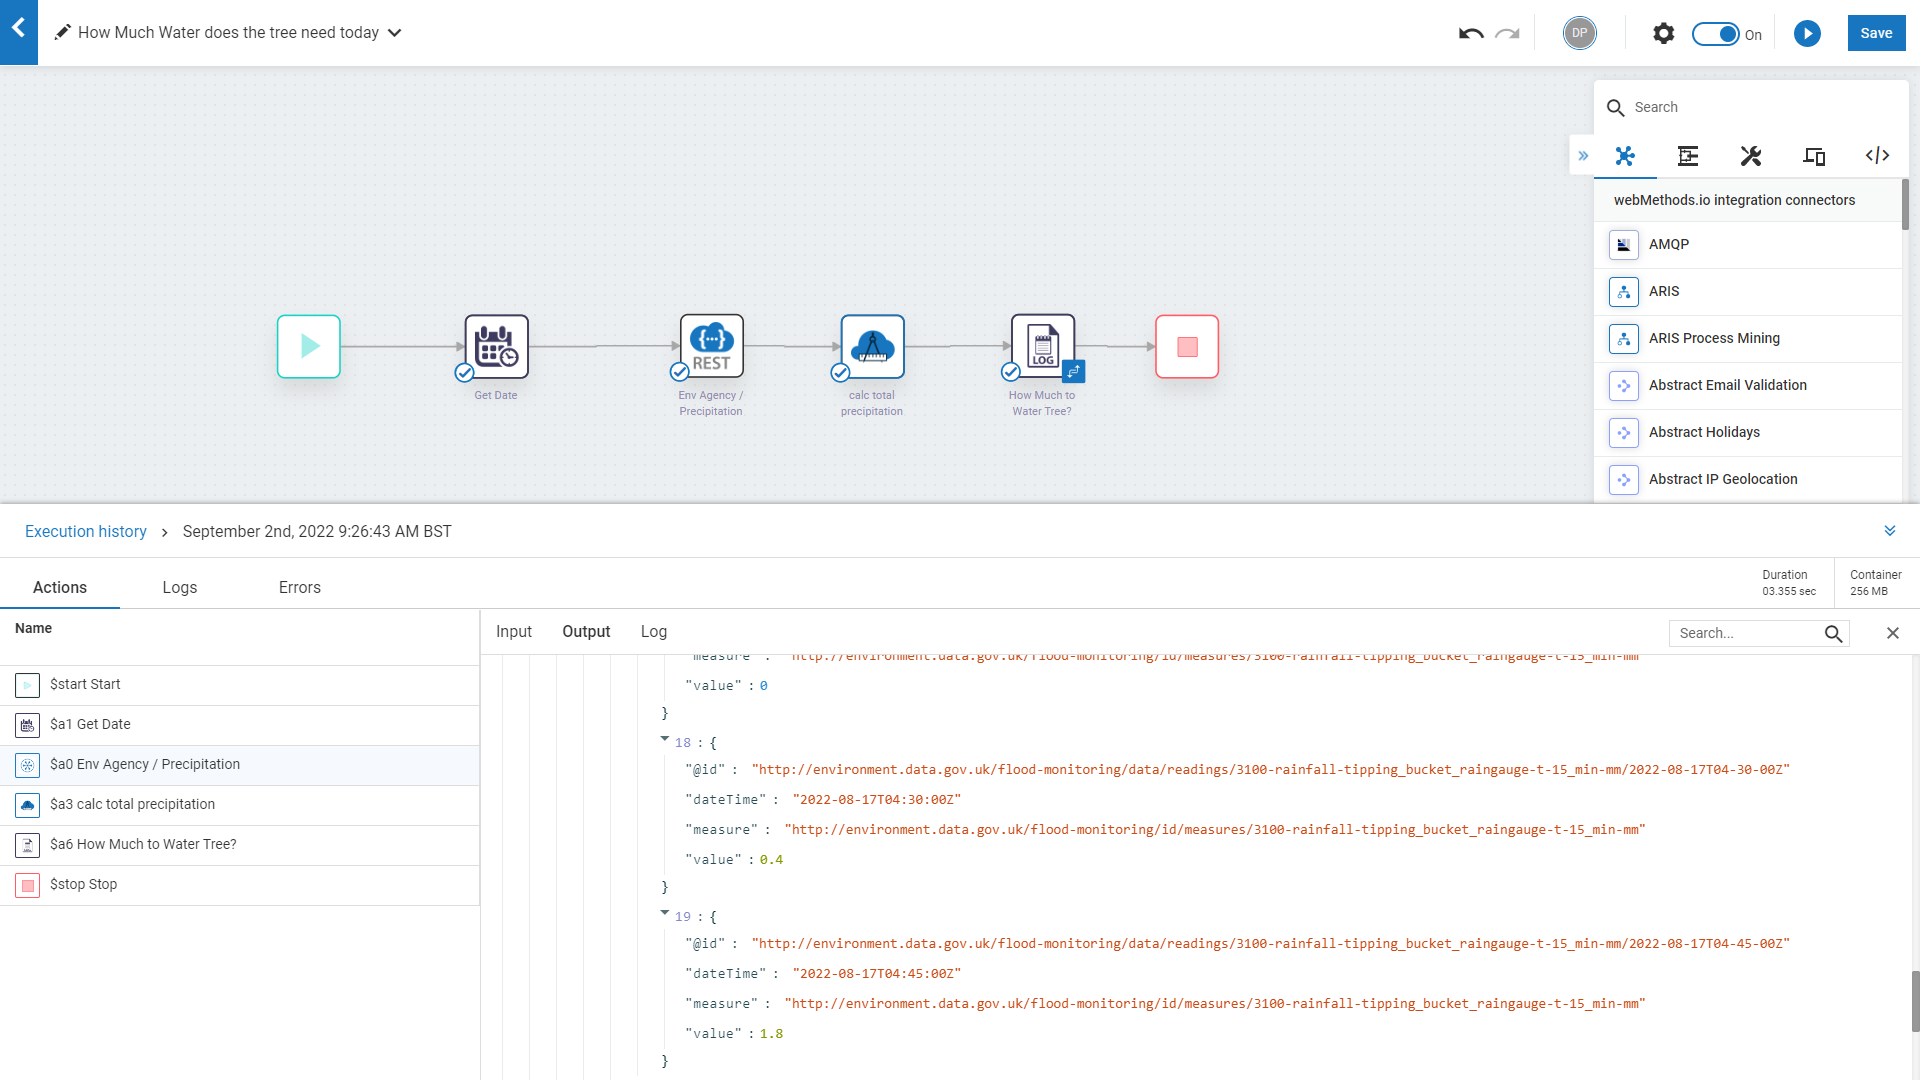
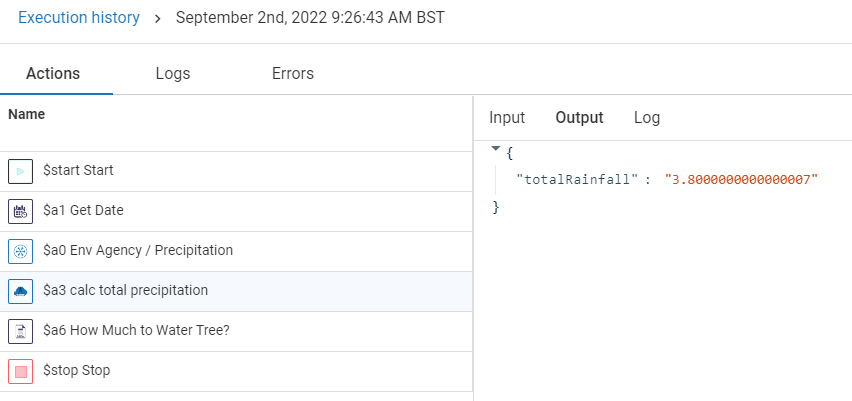
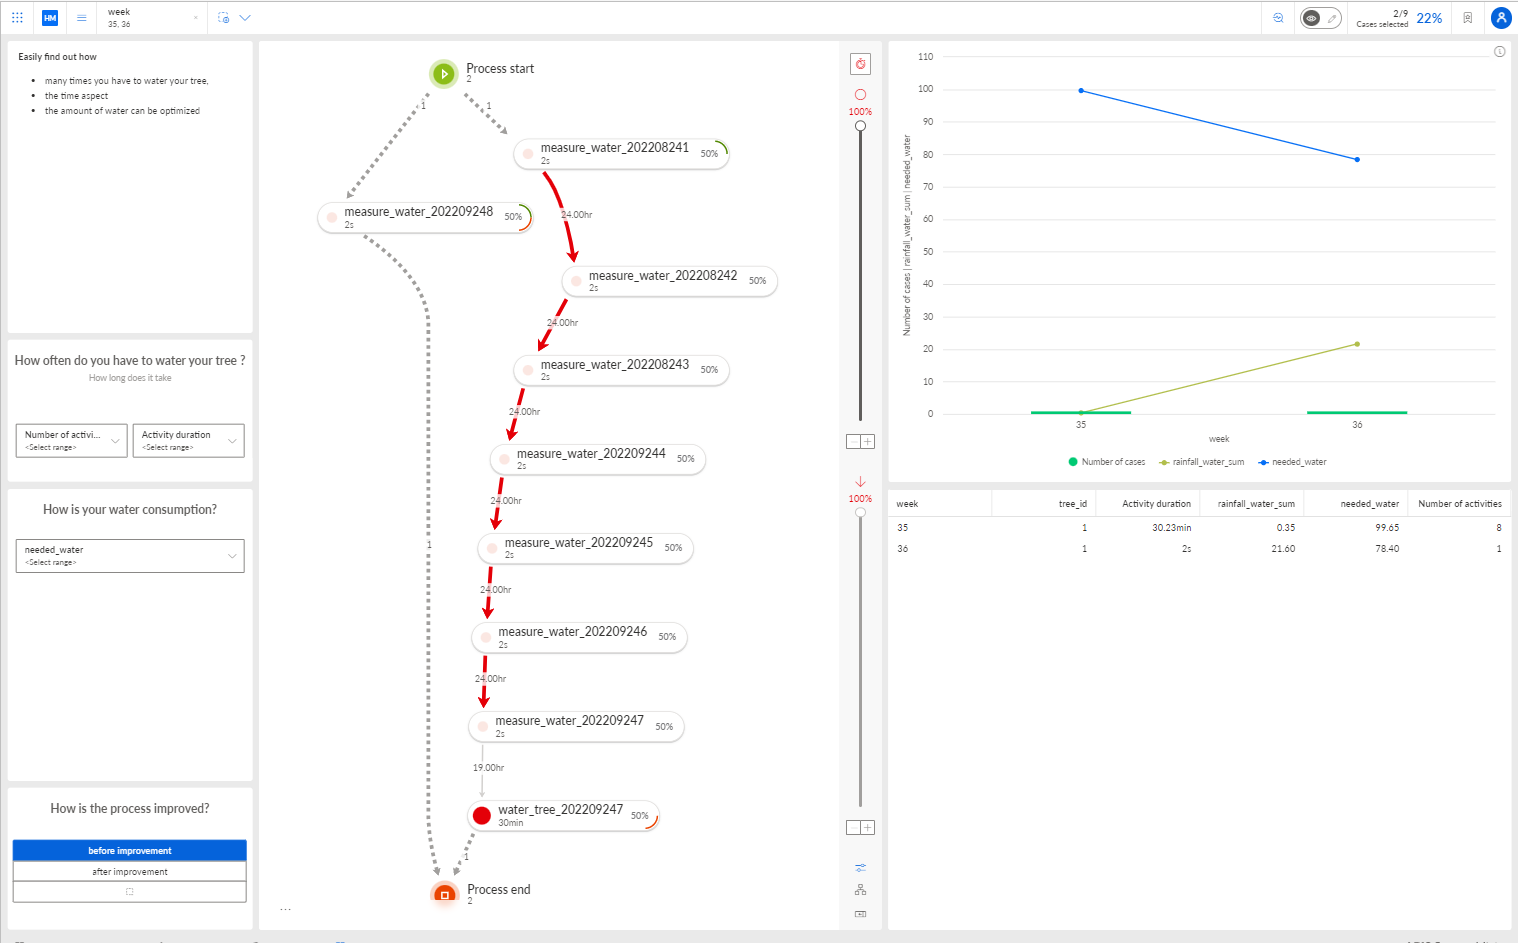
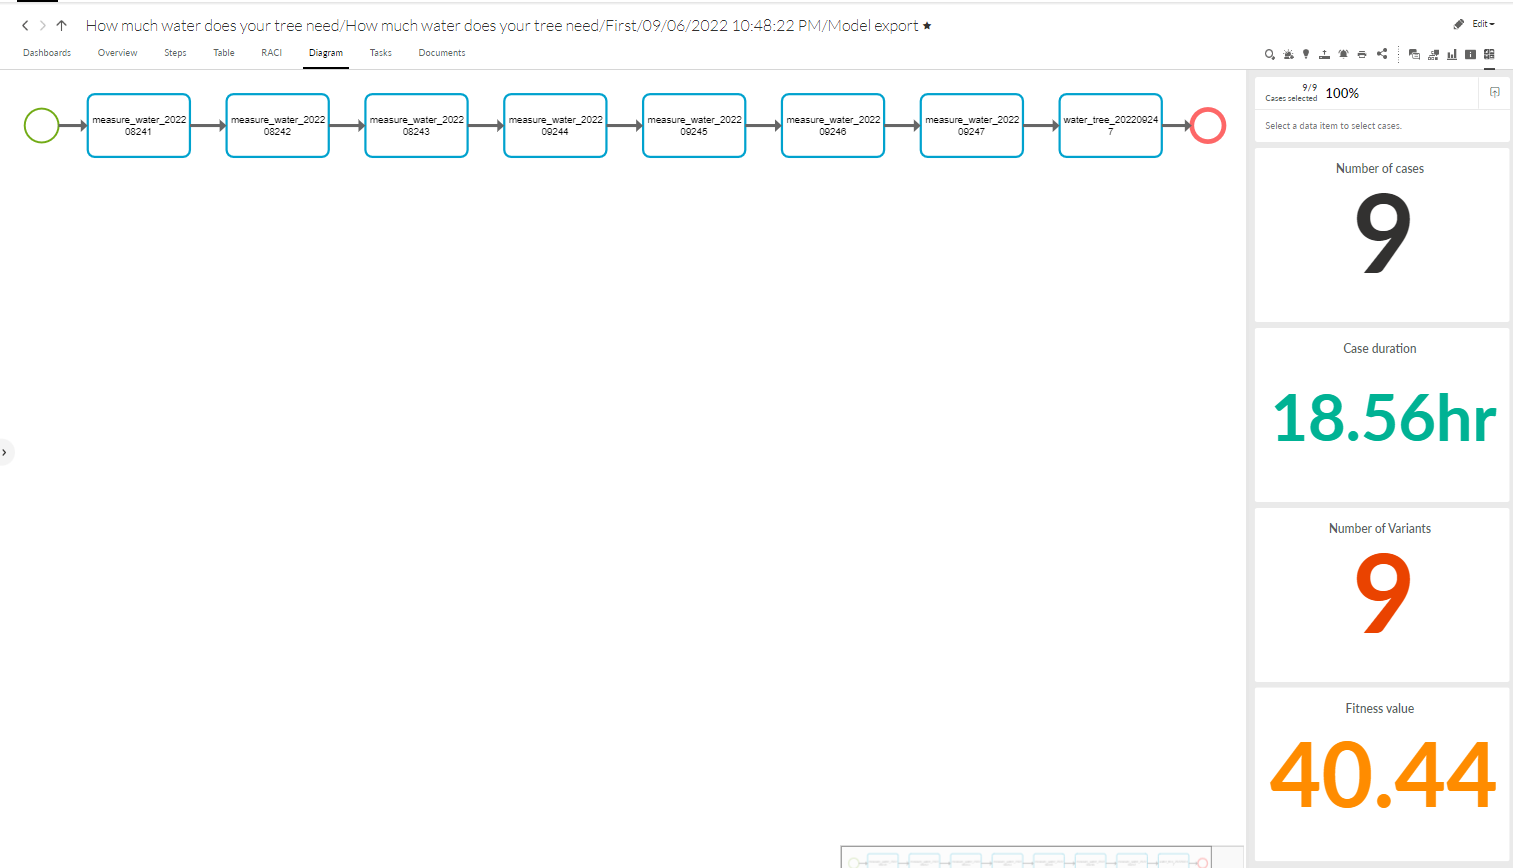
Create an integration that calls an API to find out the amount of rain that has fallen, then calculate how much water still needs to be flowing for the tree to survive and post/return that result.

Stretch goals:

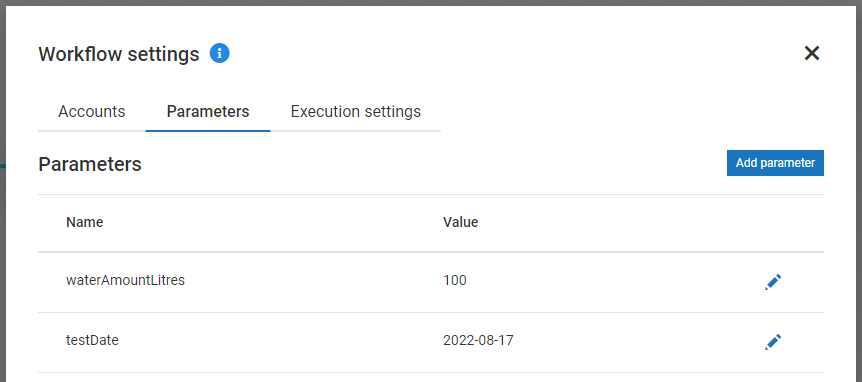
• Allow using city, country, and/or zip code instead of longitude and latitude as input parameters.
• Take into account the weather for the current/next days (or week) to determine whether additional water is really needed.

By the way: once you have the results from the above iPaaS Puzzle, why not connect it to your garden watering system to dial down the watering to exactly what is needed on rainy days.

Data Sources

In the UK there is the following environmental data API that you can call to get rainfall data for specific weather stations, or coordinates over given time periods:

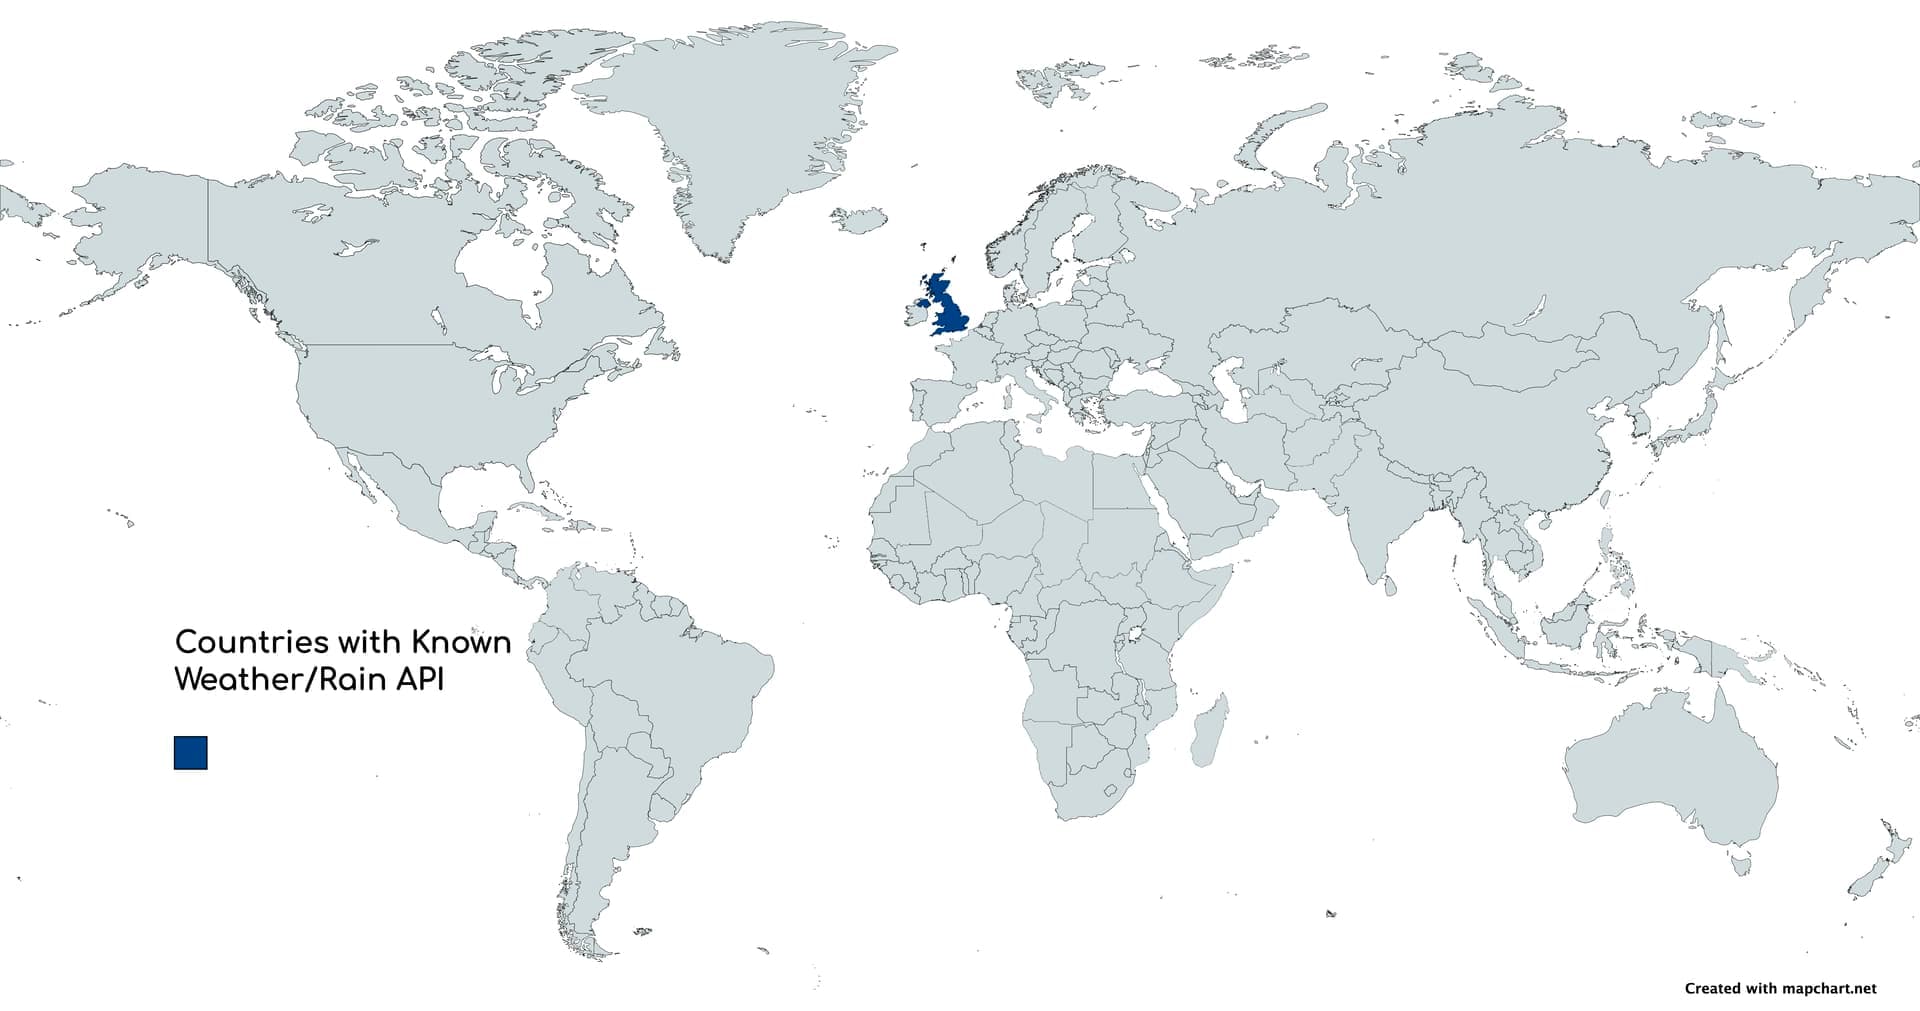
Please find and post similar data sources for your country in the comments. Let’s turn this map blue!

Submissions

Please post your solution to the puzzle as replies to this thread.

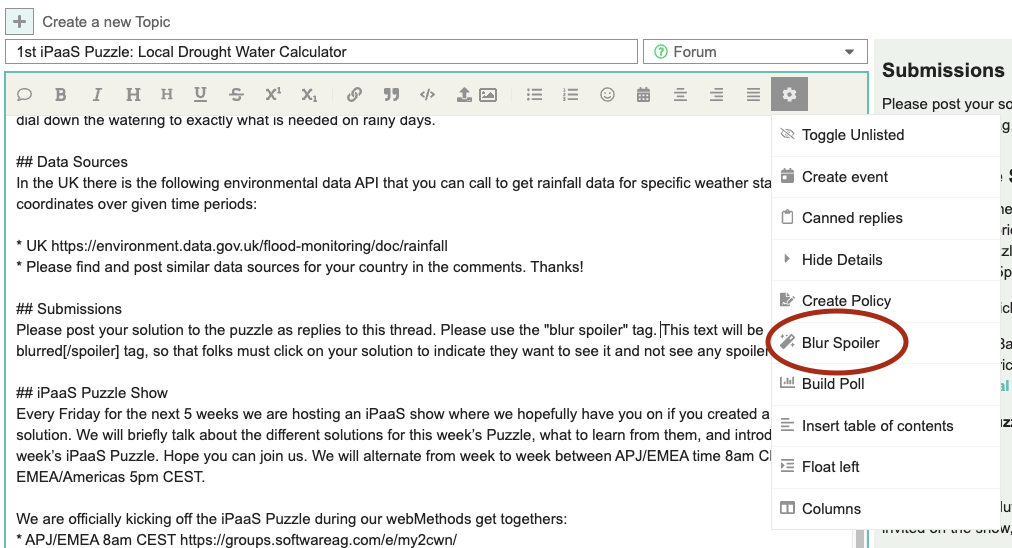
Use the “blur spoiler” tag to hide your results so that folks must click on your solution to indicate they want to see it!

iPaaS Puzzle Show

Every Friday for the next 5 weeks, starting on the 9th of September, we are hosting an iPaaS show you hopefully join us to explain your thinking behind your interesting solution.

We will briefly talk about the different solutions for this week’s Puzzle, what to learn from them, and introduce next week’s iPaaS Puzzle. Hope you can join us. We will kick it off on the 9th of September with two iPaaS Puzzle Shows and then alternate from week to week between APJ/EMEA time 8am CEST and EMEA/Americas 5pm CEST.

We are officially kicking off the iPaaS Puzzle during our webMethods Get-Togethers:

The 1st iPaaS Puzzle show will be on Friday the 9th of September 8am CEST! and 5pm CEST! Details to come!

Deadline

Just have your solution posted before the iPaaS Puzzle Show on Friday the 9th of September 8am CEST. If you want to be invited on the show, please post your solution by Thursday the 8th 8am CEST.

Prizes

The winners get fame and glory. We want this to be a friendly competition we want to highlight great work, without having to crown a weekly winner.

Suggest a Puzzle

If you have another great idea for an iPaaS Puzzle, please suggest it in this form. It must be a little challenge that is doable within a week and has easy access to the source data needed. If your challenge is geared towards improving our lives, then even better!

If your iPaaS Puzzle suggestion does get selected, we’d invite you to personally introduce it in our iPaaS Puzzle Show and you will receive a wooden Tangram game as a token of our appreciation.


The actual prize may look different!

5 Likes

One of the first steps to solve our Puzzle all over the world is having access to local rain data.

Thanks to @Dave_Pemberton we have the rain data source in the UK :slight_smile:

Help us make this map blue by posting links to your country’s rain data source. Thanks!

Second step that you can do in parallel is activate your Free Forever Edition Trial Offer by webMethods.io and set up the flow.

image

On LinkedIn @Mahesh_K_Sreenivas has posted the data source for Australia!

Bildschirmfoto 2022-08-29 um 08.11.50

Australia BOM: Australian Bureau Meteorology API (Overview, SDK Documentation & Alternatives) | RapidAPI

Also on LinkedIn Michal Krawczyk posted the link to the Polish weather source: Dane publiczne

Bildschirmfoto 2022-08-29 um 14.51.32

Our world map is a little bluer :slight_smile:

1 Like

Here is a curl example to get rainfall for Paris

## Request
curl "http://webservice.meteofrance.com/rain?token=__Wj7dVSTjV9YGu1guveLyDq0g7S7TfTjaHBTPTpO0kj8__&lat=48.856613&lon=2.352222&lang=en"

regards,
John.

2 Likes

https://mausam.imd.gov.in/imd_latest/contents/api.pdf - APIs for India but needs permissions to access :frowning:

1 Like

South Africa’s rainfall measurements are here -

https://saas.afrigis.co.za/rest/2/weather.measurements.getByCoord/myapisamples/bBFMNngfUSqQ80kFWUwmihszdPs/?location=-25.808589,28.255833&location_buffer=10000&station_count=3

If someone has the bandwidth to obtain access/authorization, the following coordinates will provide the measurements for the World Heritage site named Cradle of Humankind here in SA. The URL with its lat-long is as follows (it doesn’t work at present) -

https://saas.afrigis.co.za/rest/2/weather.measurements.getByCoord/myapisamples/bBFMNngfUSqQ80kFWUwmihszdPs/?location=-25.925386,27.767382&location_buffer=10000&station_count=3

KM

APIs for Canada: MSC GeoMet API and geospatial web services - Canada.ca
I haven’t tried them myself.

2 Likes

Thanks everyone for posting data sources I have updated the map in the post accordingly.
Should we blur the data source in the comments? @wayne.leishman.20059 did it for Canada. I can see the argument/benefit for both sides.

Deutscher Wetterdienst API site Deutscher Wetterdienst API - OpenAPI Documentation (bund.dev)

Unblurred, as I don’t have the exact API call yet to get the rain data for the last 24 hours.

1 Like

Open Data provided by the Belgian government:

2 Likes

Open Data provided by the Dutch government: KNMI - Data ophalen vanuit een script

3 Likes

One of many APIs from Brazilian National Institue of Meteorology (INMET):

curl https://apitempo.inmet.gov.br/condicao/capitais/2019-10-22

Wheather API catalog can be found HERE

3 Likes

Rainfall API for Vienna: Schnellstart Leitfaden — dataset-api 1.0 Dokumentation

Puzzle Solution:

EDIT:
I modified my solution so that it always returns result for the last 24h. I also decided to set 14L water as an assumed amount which tree needs per day to stay healthy.

11 Likes

Congratulations Anela on being the first solution posted :slight_smile:

3 Likes

Just so Anela isn’t alone in here, Here’s my solution for a tree in the UK!

Hoping to see many other solutions soon :slight_smile:
There are numerous ways and approaches to achieve the outcome for this puzzle, so I’m anticipating many different solutions and implementation choices/styles!

I used a combination, of Workflow (no-code), FlowService (low-code) and the REST Connector Creator.

The workflow:

  1. Gets the date in the correct format for the API, and is driven from a workflow parameter which allows me to test this for different dates (given it hasn’t rained much for quite some time!)


    You can see here, it’s got a date value 2022-08-17 (the last day I can remember with rainfall), but if I want to get today’s rainfall, I just use now as the parameter value.
    I could also use the date action to subtract a whole day - lets say I wanted to look at yesterday’s data (not today).

  2. Once it’s got the date (in the right format), then it uses the UK environment agency API (https://environment.data.gov.uk/flood-monitoring/doc/rainfall) to retrieve the historical rainfall data. For this, I created a reusable REST connector.


    .

    .
    Rather than use a location, I selected to use weather stations, but the lat/long could equally have been used via the API, which in essence just then finds the closest weather station to your coordinates.
    .
    Why did I use a REST API Connector - it makes this a reusable connector that any other person could use, to build other integrations in the same project. This ‘masks’ the API complexity from a non-technical user who might be orchestrating the actions in the workflow.

  3. Now we have the historical rainfall data for the given date, I next need to calculate how much water the tree needs. This isn’t quite as simple as you might think, because this depends on tree size, etc. I found a stat which basically says a tree with an area of 1m2 needs 100 litres of water daily, so I made an assumption the tree I adopt is 1m x 1m just to keep the maths simple :slight_smile:. For this calculation I used a FlowService, as this meant I could work with data from 1 or many weather stations, etc.
    .
    This flow services takes the response from the environment agency API, then loops through each of the data items (recorded at 15 minute intervals), creates a running total, and then eventually returns this:

  4. Finally (and really just to demonstrate something different, I could’ve done this in the same flow service), to calculate how much water was needed, here I used a transformer in the workflow itself, so I added a ‘logger’ and created a transformer on this step, with the logger showing the needed amount of water. You can see the blue square on the workflow diagram showing there’s a transformer there. The transformer simply takes the needed rainfall (100litres - set in a workflow parameter), and subtracts the total amount of rainfall for that date calculated from the flow service:

So what does this look like when it runs!

Here’s the API response from the connector:

Total rainfall in litres on that day:

Then finally, I do the calculation to work out how many litres the tree needs taking into account the amount of rain:
In this example: 96 litres
image

Sadly if I run this for most days right now, the tree needs 100 litres :frowning:

Export of the integration is attached.

This can be imported back as a workflow, or you can use the import APIs documented here: webMethods.io Integration API Reference - webMethods.io Integration) or here (GitHub - SoftwareAG/webmethods-io-integration-apicli: webMethods.io integration Public APIs CLI tool) for a node.js based CLI that utilizes the APIs)
UK-How much water does my tree need.zip (87.9 KB)

4 Likes

For the Iberia weather we have an awesome API-key secured resource from the AEMET:

1 Like

This weekend originally I wanted to try to solve this puzzle, but then I procrastinated and got distracted by AI Art Generation engine Midjourney

The origin of our iPaaS Puzzle was a story of Freiburg citizens adopting trees in their hoods to save them from drying out. I tried to capture that in an AI generated picture. An old Oak tree in Freiburg getting watered by the citizen with the Munster in the background.

Here are a couple of the results:


Therefore be careful, you can easily get lost in tweaking the parameters. :slight_smile:
For the tinkerers among us, you can download the open source AI Art Generation Engine Stable Diffusion and run it on your machine.

Good job. But you took the only reliable weather station in Austria. So I can’t join anymore :grin: But I want to suggest to broader this solution to other SAG products. Like of course ARIS Process Mining & ARIS 4 sustainability.

Put it in a process context, connect to an ESG (Environmental Social Governance)strategy.
Find out the current AS_IS process (like water your trees) find the bottlenecks (with Root cause miner) and of course improve the behavior to the desired as is (use the weather station data to optimize your water treatment. Outcome more happy trees , less water usage :wink: Only possible with ARIS & ARIS process mining

3 Likes

There’s many other ways to solve this, even using the same weather station API @Monika :slight_smile:

2 Likes

Well well well have you ever thought about that you now have conviced people to water their trees in the neighbourhood?
Maybe they will do it in different ways in means of time and watering.
If you want to find out what the best way would be to optimize your way of working, find out bottlenecks or best practises and learn from this insights and roll it out globally as a new standard to optimize your water consumption and time efforts to practically water more trees :evergreen_tree: :evergreen_tree: .
Then we are talking about Process Mining, process optimization and other fun stuff of SAG :grinning:

@Dave_Pemberton with your help I was able to load 3 weeks of data into ARIS Process Mining

First week - I went like maybe everyday to my tree and water it with the desired amount of water (this takes me 30 minutes time everyday and a lot of water 100 litres per week)

So I analyzed all data with process mining and realized that some clever person in the company takes the rainfall in count and does only weekly watering → this leads of course to less time duration and less water consumption. So we have a process optimization potential in means of time and water.


So why not take a best practise and make this the new way of working - means the new standard approach? So that I can compare this new to be model with my actual as_is execution, measure how conform I am or how close I am to my optimized process? I can easily put it next to a model (so that every one can see the real execution next to the model) or for higher analyis make more comprehensive analysis (using root-cause-miner or conformance check analysis)

And if this is not enough I can roll this out as new standard procedure and measure again if this is the new way of working to obtain operational excellence.
If this is not there could be also a nice wm.io workflow triggered e.g after 6. days a short notice - in case there was no rainfall please water your tree with the accurate amount (needed water - rainfall).

If you are interested in this topic there will be a webinar 22nd september 2022 - listen to one of our customer who is already on this process optimization journey

6 Likes